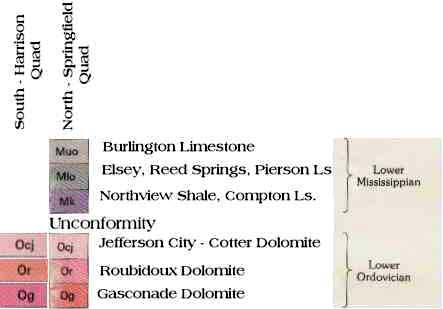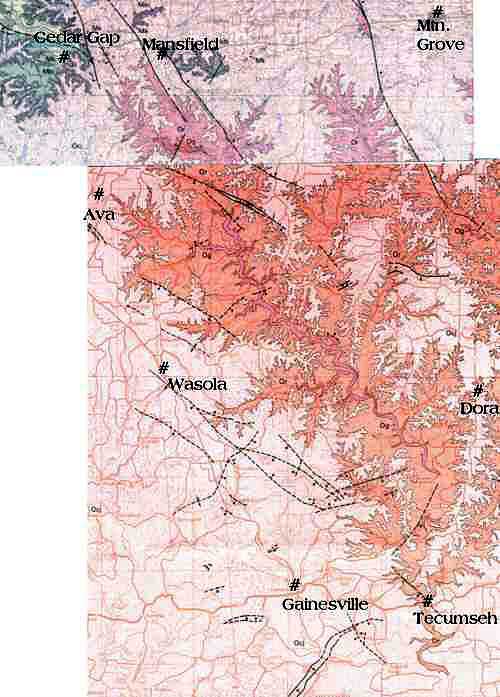
Black lines indicate faults. Colors represent different
rock formations.
Different colors at the top are the result of combining scans of portions
of two different geologic maps: the Springfield 1x2 Quadrangle (Map I-2029,
U.S.Geological Survey) to the north and the Harrison 1x2 Quadrangle (Map
I-2548, U.S.Geological Survey) in the south.